
Page 5 - Dairy Dimension - Jan
P. 5
| Volume 1 | Issue 2 | Jan-Feb 2025 ARTICLE | Volume 1 | Issue 2 | Jan-Feb 2025
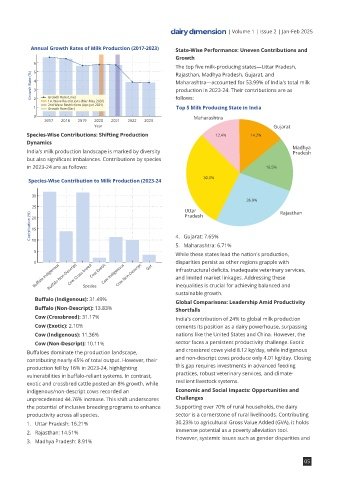
Annual Growth Rates of Milk Production (2017-2023) State-Wise Performance: Uneven Contributions and
Growth
6
The top five milk-producing states—Uttar Pradesh,
5
Rajasthan, Madhya Pradesh, Gujarat, and
Growth Rate (%) 4 3 Maharashtra—accounted for 53.99% of India's total milk
production in 2023-24. Their contributions are as
ANANLYSIS 2 Growth Rate (Line) follows:
1st Wave Restrictions (Mar-May 2020)
1 2nd Wave Restrictions (Apr-Jun 2021) Top 5 Milk Producing State in India
Growth Rate (Bar)
OF INDIAN 0 Maharashtra
2017 2018 2019 2020 2021 2022 2023
Year Gujarat
Species-Wise Contributions: Shifting Production 12.4% 14.2%
Dynamics
Madhya
India's milk production landscape is marked by diversity Pradesh
but also significant imbalances. Contributions by species
INDUSTRY in 2023-24 are as follows: 16.5%
30.0%
Species-Wise Contribution to Milk Production (2023-24
30
26.9%
25
Uttar Rajasthan
Pradesh
India's Dairy Sector: Contribution (%) 20
15
A Comprehensive Analysis of 10 5 4. Gujarat: 7.65%
5. Maharashtra: 6.71%
While these states lead the nation's production,
Progress and Challenges 0 Cow Exotic Got disparities persist as other regions grapple with
Buffalo Non-Descript
Cow Non-Descript
infrastructural deficits, inadequate veterinary services,
by Dairy Dimension Buffalo Indigenous Cow Cross breed Cow Indigenous and limited market linkages. Addressing these
inequalities is crucial for achieving balanced and
Species
India's dairy sector, a linchpin of the nation's agricultural Milk Production Trends in India (2017-2024) sustainable growth.
economy, plays an indispensable role in ensuring 240 · Buffalo (Indigenous): 31.49% Global Comparisons: Leadership Amid Productivity
nutritional security and driving rural economic growth. 230 · Buffalo (Non-Descript): 13.83% Shortfalls
As the world's largest milk producer, India has carved a 220 · Cow (Crossbreed): 31.17% India's contribution of 24% to global milk production
niche for itself on the global stage. However, recent · Cow (Exotic): 2.10% cements its position as a dairy powerhouse, surpassing
trends expose significant vulnerabilities and systemic Milk Production (Million Tonnes) 210 · Cow (Indigenous): 11.36% nations like the United States and China. However, the
challenges that threaten sustained growth. This article 200 · Cow (Non-Descript): 10.11% sector faces a persistent productivity challenge. Exotic
delves into production dynamics, species-wise 190 Buffaloes dominate the production landscape, and crossbred cows yield 8.12 kg/day, while indigenous
contributions, state-level performances, and structural contributing nearly 45% of total output. However, their and non-descript cows produce only 4.01 kg/day. Closing
barriers, offering strategic insights for policymakers and 180 production fell by 16% in 2023-24, highlighting this gap requires investments in advanced feeding
stakeholders. 2017-18 2018-19 2019-20 2020-21 2021-22 2022-23 2023-24 vulnerabilities in buffalo-reliant systems. In contrast, practices, robust veterinary services, and climate-
Year
Milk Production Trends: Alarming Deceleration in for the industry. Contributing factors include outbreaks exotic and crossbred cattle posted an 8% growth, while resilient livestock systems.
Growth such as Lumpy Skin Disease and uneven resource indigenous/non-descript cows recorded an Economic and Social Impacts: Opportunities and
India's milk production reached a record 239.30 million distribution. Furthermore, per capita milk unprecedented 44.76% increase. This shift underscores Challenges
tonnes in 2023-24, representing a modest 3.78% availability—currently 471 grams/day—remains skewed, the potential of inclusive breeding programs to enhance Supporting over 70% of rural households, the dairy
increase from the previous year. While the decade has disproportionately affecting rural and economically productivity across all species. sector is a cornerstone of rural livelihoods. Contributing
seen a cumulative growth of 51.05%, annual growth disadvantaged populations. Strategic interventions to 1. Uttar Pradesh: 16.21% 30.23% to agricultural Gross Value Added (GVA), it holds
rates have consistently declined: immense potential as a poverty alleviation tool.
address these systemic inefficiencies are imperative. 2. Rajasthan: 14.51%
The declining growth trajectory raises critical concerns However, systemic issues such as gender disparities and
3. Madhya Pradesh: 8.91%
04 05